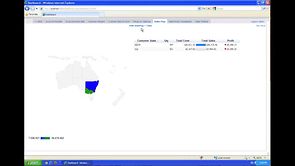
Heat-map visualisation of sales performance by state.
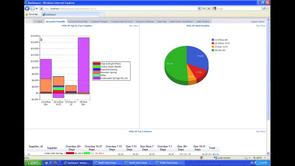
The Accounts Payable dashboard provides an overview of your top Suppliers along with a Pie chart of your payments ledger allowing you to instantly see payment ageing.
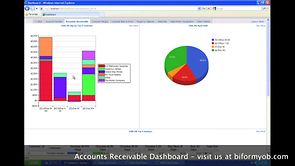
The Accounts Receivable dashboard provides an overview of your Debtors along with a pie chart of your receivables ledger allowing you to instantly see receivable ageing.
Dashboard of Top 10 Customers to identify costs, sales, profit and margin.
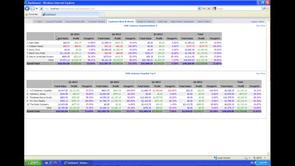
Dashboard showing two pivot reports of Top 5 and Bottom 5 Customers by Quarter.
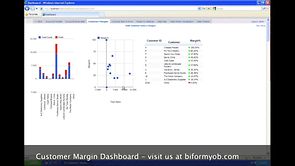
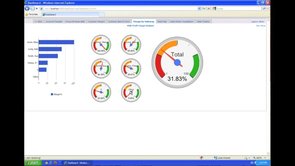
See individual sales representative margin and group aggregate margin from your MYOB data.
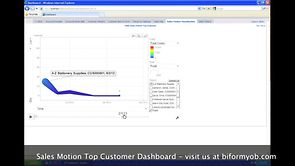
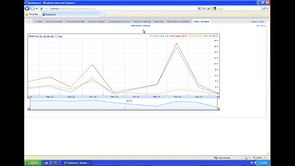
Sales Motion Dashboard allows you to visualise your sales in four dimensions and track each over time. Easily see sales volume, cost, profit and quantity for selected customers.
Recent Comments